
Accelerating Sustainability through the Accelerated Adoption of Technology
10 October 2021Author: Joe Venegas
Company: Rollepaal BV
Dedemsvaart, The Netherlands, 2021
ABSTRACT
The necessity for action on climate change is clear, and the plastics pipe industry has a role to play. First and foremost plastic pipe is a significant improvement compared to traditional materials. Further, several technologies already exist which further allow plastics to reduce their environmental impact by 30-50%. What is needed now is more innovation to speed up adoption of these technologies. They must be more robust and easier to implement to speed up efforts to slow down climate change. We must also become better at using our data to learn from successes and failures as we adopt new technologies more quickly.
INTRODUCTION
The necessity is clear and Urgent
António Guterres, secretary General of the united Nations, said it best: “making peace with nature is the defining task of the 21st century. ”He continued to call the whole planet to action: “Every country, city, financial institution and company should adopt plans for transitioning to net zero emissions by 2050…(and take) decisive action now.” (United Nations, 2021)
As table 1 indicates, at Rollepaal we see climate change as the focus among five major, long-term world trends.
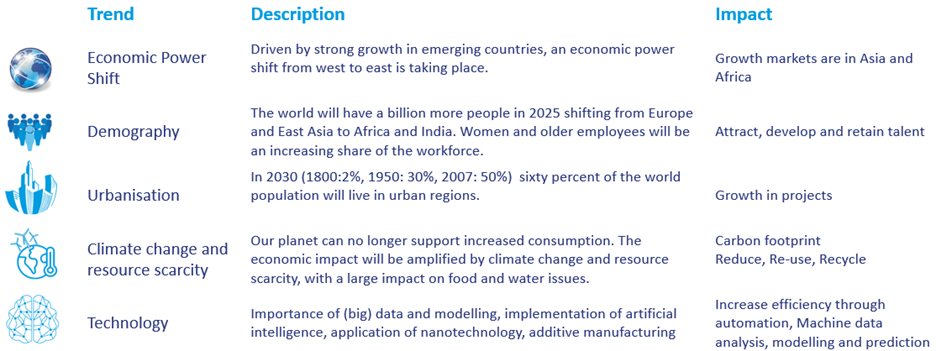
Table 1: Five Global Trends, reproduced from Rollepaal BV
Additionally, in the short term we’ve seen several trends (table 2) that seem to be the natural result of the long-term trends above.

Table 2: Two Short-term Trends in 2021, reproduced from Rollepaal BV
It is clear that Urbanization and Climate change both drive demand for water piping. First of all pressure pipe systems are required to move fresh water to growing population centers. Secondly, new storm water systems are required to adapt to the changing climate and weather patterns. Therefore, we have seen, as expected, increasing demand for piping systems. If you couple this extra demand with resource scarcity than increasing raw material price is the logical result.
We are no longer looking to the future effects of climate change. We are now seeing the effects in the present and the need to act has never been more urgent.
DISCUSSION
1. Environmental Impact of Plastic Piping Systems vs Traditional Materials
In order to know where we need to improve first we need to know where we stand. Below (Graphic 1, 2) you will find two comparisons for plastic piping systems vs traditional materials.
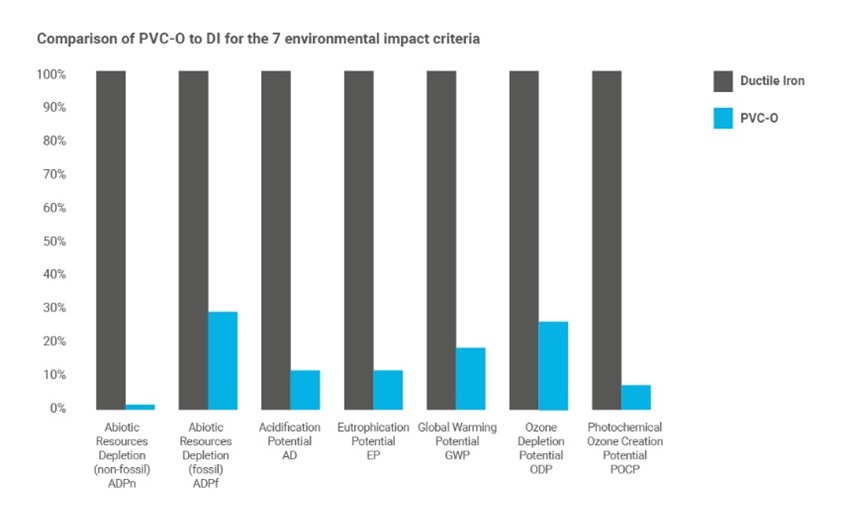
Graphic 1: Environmental Impact of PVC-O vs Ductile Iron for pressurized water supply, reproduced from TEPPFA, 2021
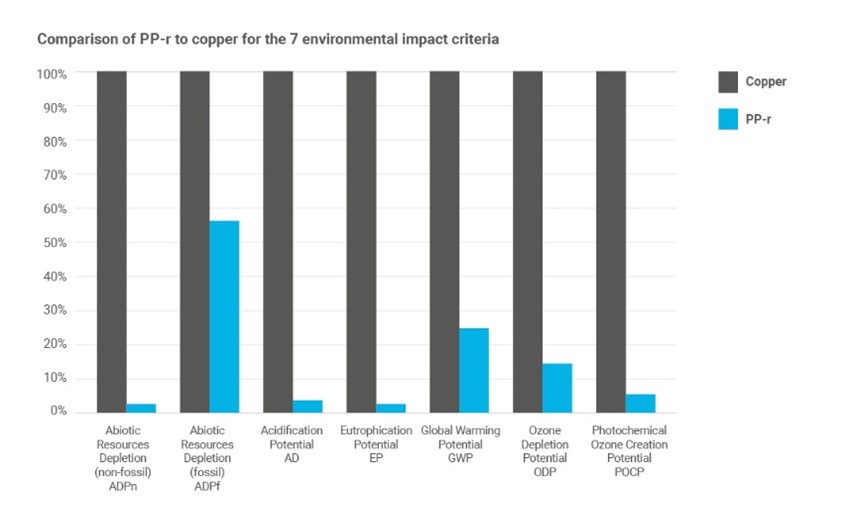
Graphic 2: Environmental Impact of PP-r vs Copper for Hot & Cold piping system, reproduced from TEPPFA, 2021
The above graphics are representative for plastic piping systems in general, which have a lower environmental impact when compared to traditional materials. However, that does not mean that we should celebrate and only focus on conversion of traditional materials to plastic. We need to evaluate the environmental impact of plastic products and look for areas of potential improvement
2. Reducing the Environmental Impact of Plastic Piping Systems
The first step towards improvement is evaluating the current situation. Below are two example graphics (graphic 3,4 ) adopted from Teppfa, showing where the environmental impact of plastic piping systems comes from. There are four categories; Product, Construction Process, Use & End of Life.
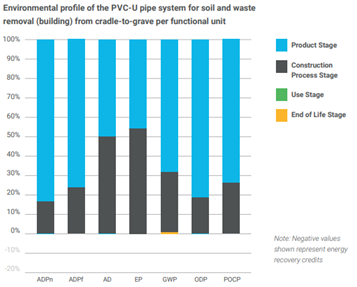
Graphic 3: Environmental Impact profile of PVC-U soil and waste systems, reproduced from TEPPFA, 2021
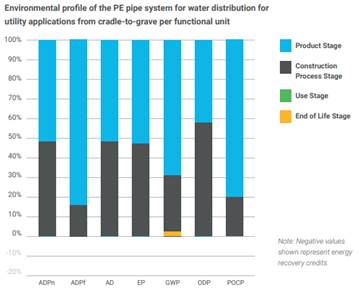
Graphic 4: Environmental Impact profile of polyethylene pipe for pressurized water supply, reproduced from TEPPFA, 2021
The above examples are illustrative of a general trend, which is that the majority of the environmental impact of a plastic pipe comes in the production stage. If we focus directly on global warming potential (GWP) 70% of the environmental impact comes from the production of the pipe itself. Further analysis we’ve conducted on pipe production shows that the usage of plastics accounts for 60-80% of the environmental impact in the production stage.
Conclusion: If we want to significantly reduce the environmental impact of plastic piping systems then the biggest gains can come from reduction in material.
The call to reduce our raw material consumption is very similar to how the auto industry is called to reduce fuel consumption. Of course, there are other impacts on climate change in the production and use of an automobiles but 80% of the total impact comes from fuel consumption. For piping systems it is not quite as dramatic as for automobiles but still significant. 45%-55% of the global warming potential of a plastic piping system comes from material usage.
3. Reduction in Material Usage is also aligned with our Business Interests
It is not a coincidence that 70-80% of pipe production costs come from material usage. It reflects what we see in the environmental impact analysis. Therefore, it’s directly in our financial interest to reduce material consumption. If we can reduce material consumption, while fulfilling the same product requirements, we can also reduce costs and improve profits.
At the same time, reducing the material we use makes our industry and our businesses more sustainable in the long term. Over the last year, several regions around the world had shortages of raw materials. During those shortages, we observed that pipe producers chose to run lines that consumed less material per meter, such as Multi-layer PVC or PVC-O lines. The reasoning was simple: With the same amount of material 30-50% more meters of pipe could be made on a multi-layer or PVC-O lines compared to other products. That was simply 30-50% more pipe which could be sold.
To put it simply, if recent trends continue then the most robust businesses will be built around products that use the minimum amount of material.
4. Innovation is needed to speed up adoption of Existing Technologies
Many technologies already exist which can dramatically reduce material consumption:
- Structured wall pipes
- Foamed core pipes
- PVC-O
There are more than the above mentioned but those are well known in the industry. The real question is how we can speed up adoption of these products and others, which reduce material consumption. Again, it is very analogous to the automotive industry, and the quest to speed up adoption of electric vehicles.
The technologies are there to reduce materials, and they are well known, but they are not yet the majority of the pipe produced in our industry. Regardless of the technology; corrugated, foamed core, PVC-O, etc, the reduction of material comes with increased complexity in production. It is naïve to think that as an industry we can quickly add this complexity to our production environments. In fact, most manufacturers roll out the implementation of a single line over several years before then adding additional lines. This allows knowledge to be first built before expanding. This however is a slow process and will not allow us to move quickly.
Hence, as an industry we can do two things to speed up adoption:
- Reduce the complexity of operating these lines
- Learn more quickly
Reducing the complexity of Operation, and Increasing the Robustness
The tools needed to increase robustness of our manufacturing installations already exists. Scanner and gravimetric technology already allow us to measure in real time what is occurring in a pipe extrusion line. Built upon those tools, closed loop systems already exists to automatically control meter weight, wall thickness and centering.
As a first step, basic systems need to be standard on more complex production installations.
Example: Multi-layer Foamed Core Production
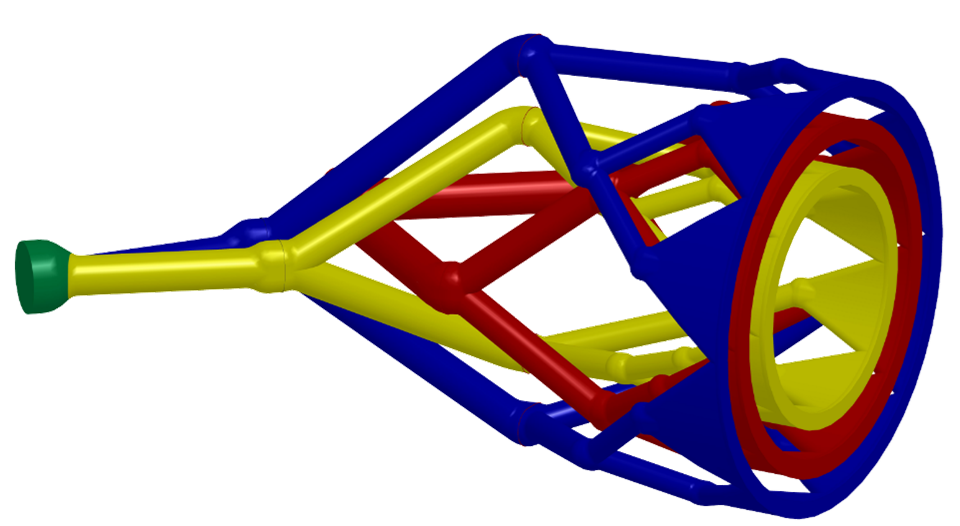
Figure 1: Flow-line from a Multi-layer die head, reproduced from Rollepaal BV. (2021)
Most foamed pipe applications require the use of multi-layer pipe production. In the figure 1, you can see three separate flows that create the multi-layer pipe. The blue and yellow flows form the skin of the pipe while the red flow forms the core of the pipe, which can be foamed. In most applications, and as shown above, the blue and yellow flows for the skins of the pipe come from one extruder and red flow for the core of the pipe comes from another extruder.
One simple way to improve process robustness and product quality is to use gravimetric feeding on both the skin and core extruder. Balancing flow between the skin and core extruders is one of the key requirements for consistent production. The use of gravimetric systems on both extruders dramatically reduces the variation in extruder output and dramatically improves the robustness of the production process. It may seem simple, but not having gravimetric fitted on a line which is converted to multi-layer production can cause a world of unnecessary headaches, and slow down the adoption of this technology.
As a second step, we need to create more automation in the production process.
Example: PVC-O

Figure 2: Basic Layout of an RBlue PVC-O production line, reproduced from Rollepaal BV. (2021)
Using the above PVC-O line (Figure 2) as an example it is clear that existing automation and control technologies have been used wherever possible.
Creation of the pre-form or feedstock pipe:
- Gravimetrics for feeding of the extruder
- Scanner in the first cooling tank
- ATC for control of the centering of the die
All of the above-mentioned technologies are basic control systems that could be applied to any extrusion line, however in this case they are even more valuable since the pre-form pipe will be stretched. Any inconsistency in the pre-form will of course lead to inconsistency in the stretching process. Therefore, the first step in a robust PVC-O process is robust pre-form production.
Stretching of the Pipe:
- Scanner for measurement of wall thickness
- Automatic thermal centering of the stretched pipe
- Automatic synchronization of the haul-offs
All of the mentioned controls are based on standard technology that has been modified for PVC-O. Thermal centering and wall thickness control is done in the stretching unit using the same principal as in a die head. Haul of synchronization is also a special application of meter-weight control. The idea is to make the stretching process as simple and as automated as possible.
Application of known technologies is a good first step however; it is not enough to significantly simplify the production process. The RBlue process does have examples where specific steps have been made to create new automated controls for PVC-O.

Figure 3: Diagram showing the RBlue PVC-O expansion process using compressed air, Rollepaal BV, 2021
The compressed air system illustrated in Figure 3 was specifically developed with automation in mind. The use of air and several calibration rings along the outside of the pipe allows for:
- Multiple pressure zones
- Automatic flow control
Automation of the air system eliminated the need for operator intervention and allows the air in the expansion unit to automatically adjust to changing conditions. Normally, specific training to operate this equipment would be required on every shift. With this kind of automation in place, this system does not require any attention during production. This improves the robustness of expansion both during a single run and over several weeks of running.
Learning Quickly – Adapting
Regardless of the steps we take to make production simpler, the fact is that change will be required to adopt new technologies. When things change too, there are two possible outcomes: success or failure. Hence, learning from what has occurred allows us to adapt and further progress.
The average extrusion line from Rollepaal generates 0.8 GB of data per day and the majority of that data is stored on the machine never to be reviewed again. Only when there is a perceived issue is the data reviewed to try to find the root cause of the problem. If we want to rapidly change our production footprint then we need to be continuously learning, not waiting for issues to arise. We need to prevent issues before they happen.
Manufacturing management systems or production management system therefore have a role to play in the future of our industry. They can gather data from multiple production lines, store it, organize it and process it into useful information. However, these systems will not invent themselves. Our industry is unique and a generic system will not tell us anything more than we already get from OEE and similar metrics. We need tailor made systems that understand how our production lines operate, can warn us of current or future issues and review the effectiveness of our production over time.
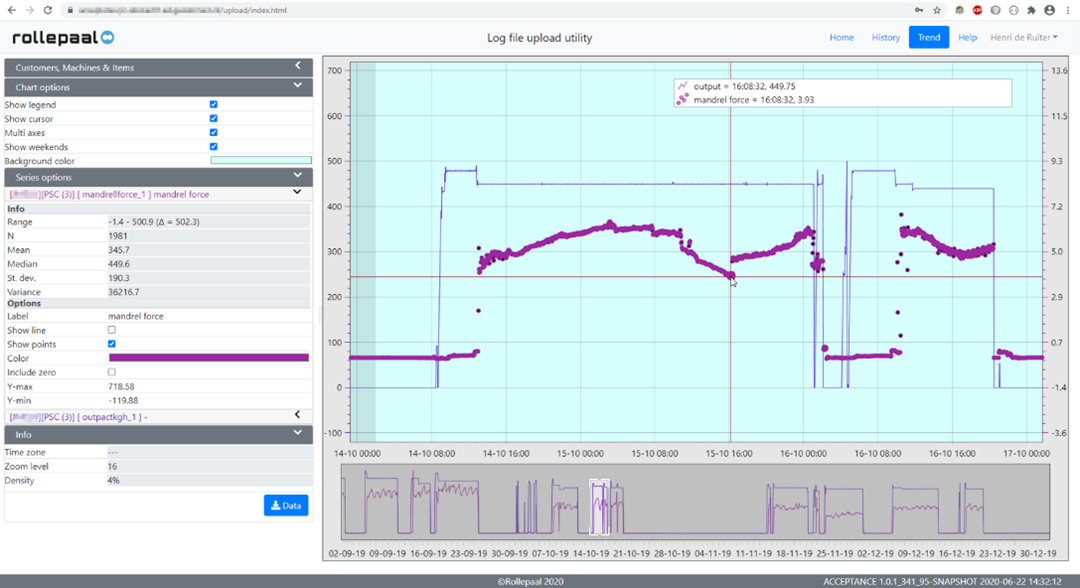
Figure 4: Screen shot of Rollepaal Online Tredviewer platform, Rollepaal, 2021
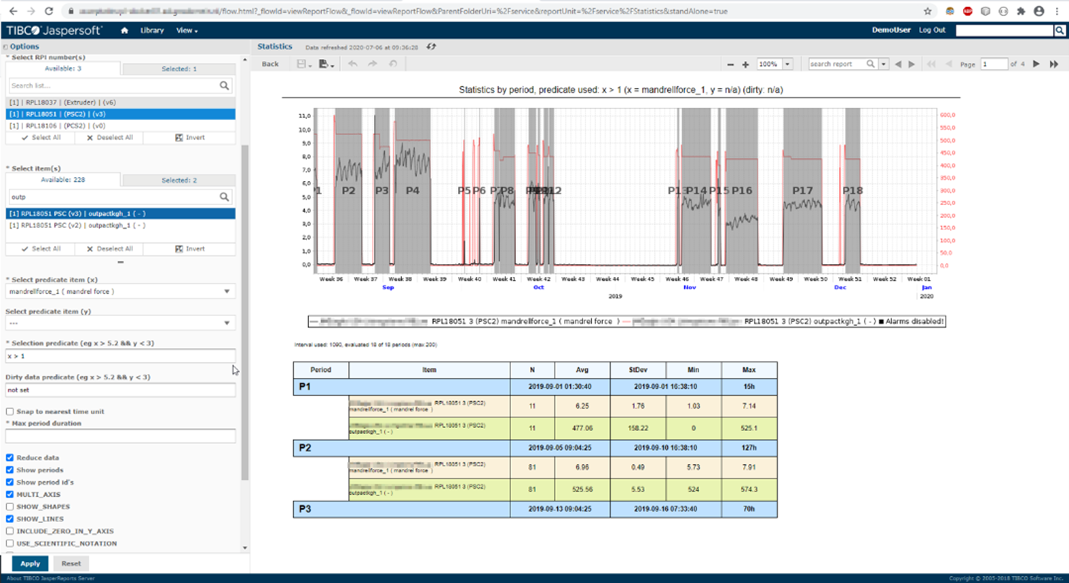
Figure 5: Screen shot of Rollepaal online analytics and statistical analysis tools, Rollepaal, 2021
As an example the online data analytics shown above (Figure 4, 5) feature pipe specific analysis. The system can automatically determine from machine data:
- Start and stop of runs
- Pipe size being produced
- Pipe in tolerance or scrap
- Whether the machines in the line are functioning as desired or require maintenance
On top of that, smart systems like shown above can automatically produce:
- Weekly or monthly reports
- Proposals for more efficient production plans
- Notifications of:
- Line down
- Machine down
- Scrap production
- Excessive overweight
- Failure of cost control systems like gravimetric and scanners
In fact, these capabilities are just the tip of the iceberg. Once all the machine data is stored in one location, identification and reporting of almost any phenomenon can be produced.
CONCLUSION
The technologies we need to significantly decrease the environmental impact of plastic pipes already exist. We need to focus on speeding up adoption. We need to make our production systems more automated and more robust. We need to store and analyze our production data so that we can learn fast and change quickly.
“Now is the time to transform humankind’s relationship with the natural world – and with each other. And we must do so together.” - António Guterres (United Nations, 2021)
References
Nations, U. (2021). The UN Secretary-General speaks on the state of the planet | United Nations. Retrieved 6 September 2021, from https://www.un.org/en/climatechange/un-secretary-general-speaks-state-planet
Molecular Oriented PVC (31,5MPa) vs Ductile Iron for Pressurised Water. (2021). Retrieved 3 September 2021, from https://www.teppfa.eu/sustainability/environmental-footprint/lca/pvc-o-315-mpa-vs-ductile-iron-di-for-pressurised-water-supply/
Polypropylene (PP-r) vs Copper Pipe Systems - TEPPFA. (2021). Retrieved 3 September 2021, from https://www.teppfa.eu/sustainability/environmental-footprint/lca/polypropylene-pp-r-vs-copper/
PVC plastic pipe systems vs ductile iron environmental impact comparison. (2021). Retrieved 3 September 2021, from https://www.teppfa.eu/wp-content/uploads/LCA2_SW-Leaflet_PVC-vs-DI.pdf
Polyethylene plastic pipe systems vs ductile iron environmental impact comparison. (2021). Retrieved 3 September 2021, from https://www.teppfa.eu/wp-content/uploads/LCA3_PW-Leaflet-PE-vs-DI.pdf